Data-logging and Supervisory Control
Overview
The LEO Data-logging and Supervisory Control (DSC, also known as SCADA and C&D) is separated into two systems:
- Landscape monitoring and control - This is currently distributed over 14 National Instruments compact re-configurable input/output (cRIO) real-time computers. (http://www.ni.com/compactrio/ ) The NI cRIO allows for a variety of I/O modules and is equipped with an onboard Field Programmable Gate Array (FPGA) allowing for additional signal processing and custom digital communication protocols.
- LEO biome environmental monitoring and control - Monitored and controlled by a variety of Allen Bradley PLCs. Details on this to come.
The first part, landscape monitoring and irrigation control, was designed to provide control and data for scientific use. It was designed with two major goals:
- To be robust and minimize data loss.
- Allow for easy and seamless integration of new sensors and new data acquisition hardware
In order to achieve these goals the system was designed to be very loosely coupled. Each subsystem is required to perform an assigned task with minimal dependence on other subsystems. The database logging system was completely decoupled from the data acquisition devices, requiring data to be provided as appropriately formatted ASCII text files. This allows new acquisition devices to be added with no impact on other acquisition devices and (ideally) only configuration changes to the database loader.
A basic diagram of data acquisition flow is shown below: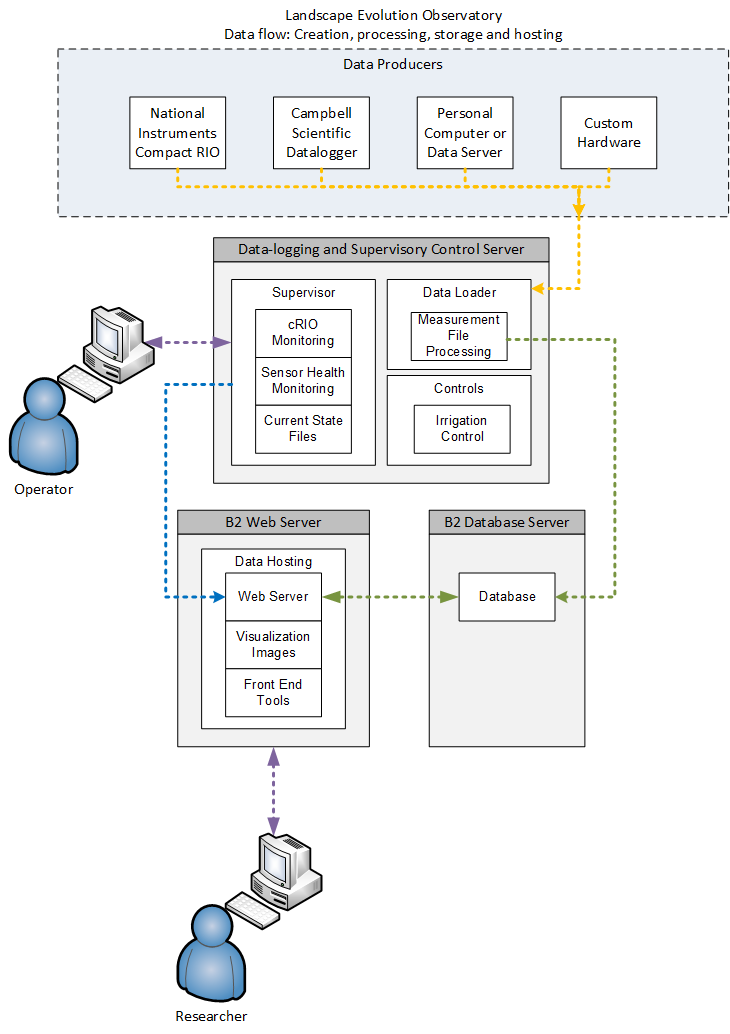
Notes
Hardware
Data Acquisition Hardware
National Instruments hardware
- NI-9074: (National Instruments) Compact Re-configurable Input/Output real-time computer with FPGA
- NI-9205: 32/16 CH 10V analog input module
- NI-9213: 16 CH 80mV analog input module (Thermocouples & low voltage signals)
- NI-9217: 4 CH 100 ohm RTD analog input module
- NI-9237: 4 CH Half/Full bridge analog input module
- NI-9201: 8 CH digital I/O module
- NI-9403: 32 CH digital I/O module
- NI-9422: 8 CH 24V digital input module
- NI-9472: 8 CH 24V digital output module
Custom hardware and equipment
Instrument (data-logging & control) electrical panels
- P01 - Monitors drainage, lower 1/3 heat flux plates & TCAVs, lower 1/2 CO2 probes, and lower 4 load cells
- P02 - Monitors middle 1/3 heat flux plates & TCAVs, middle 2 load cells, and entire SDI-12 network.
- P03 - Monitors upper 1/3 heat flux plates & TCAVs, upper 1/2 CO2 probes, upper 4 load cells, and sensors on upper two above ground masts.
- P04 - Monitors sensors on the bottom three above ground masts.
- Irrigation - Monitors inbound water flow and valve states, and controls electric valves.
- GasSampling - Performs above ground gas sampling (using the LI-7000) for the hill slopes and controls soil gas valves.
Software
LabVIEW is the required software development suite for creating the specialized software applications used by the CompactRIO devices in the LEO. In addition, some applications are developed using Java.
All software projects are stored in Subversion repositories located on the Biosphere 2 file server ( \ \..\Engineering\SVN\ )
SharedVariableExportManager - (LabVIEW) Multi-threaded application which handles data export to CSV and current state file generation
Supervisor2014 - (LabVIEW) Monitors CompactRIOs and generates Current State Files for sensors.
Surface Heat Flux Calculator - (LabVIEW) Computes the heat flux at the soil surface using data from nearby 5TM, HFP-1/SC, and TCAV.
Irrigation Control - (LabVIEW) Controls valves in each bay and allows the creation of scheduled rain events.
DataLoader - (Java) Application that parses Measurement Files and inserts data into the database.
Simple Text Instruction Processor (Selector & Valve Control) - ASCII text instructions for automation of selector, valve, and process variable control
Using the LEO data system
Uploading data to the Data Gateway is easy and requires only three things: Sensor meta data configured in the database, a correctly formatted ASCII text file, and FTP capability.
Step 1) Create the sensor in the LEO database and configure the meta data. The sensor must exist with appropriate variables, calibrations, etc. within the database in order for data for a particular sensor to be logged.
Step 2) Record data the LEO way! Data is presented in tab delimited ASCII text files called "Measurement Files" (measurement files are described here). Using this formatting scheme allows the data gateway to parse the file and insert data into the database. Plus, it's easy to read and debug!
Step 3) Upload the measurement file to the Data Gateway via FTP. FTP is a simple and well established protocol. Once a file is uploaded to the server, it is ready to be processed!
Q: Why not log directly to the database?
A: Since the system is distributed there are many remote components. This scheme limits the number of devices writing to the database to only one. This allows changes to be made to the database with minimal impact on the data acquisition devices. If the database goes offline (unexpectedly or planned) the measurement files will still be stored on the gateway server and not be processed. Thus, data is not lost during database outages.
Q: Why use measurement files?
A: This stems from the philosophy that data loggers should be self reliant and write data locally. This reduces the dependence on a stable network connection and ensures data integrity during server outages.
Q: Why use FTP?
A: FTP is simple and easy to use. Many software packages and programming languages have the capability to use FTP; Therefore, it can be easy to automate the uploading measurement files to the server.